Most dental practices spend more on a single direct-mail campaign than they would need to spend to fix the Google Business Profile mistake I’m about to describe. The fix takes maybe four hours of focused work. Once done, most of it stays done. And yet, when I went looking, almost every dental practice I examined in one square mile of dense urban Atlanta still had the gap.
I want to walk through what I found, why I think it’s so common, and what it actually costs a practice per year. Where I cite a cost figure, it’s built on industry stats I can point to — not numbers I made up to make the piece more compelling. The math is illustrative, not a guarantee for any specific practice, and I’ll be honest about which inputs are tight and which are loose.
One thing I’m not going to do: name the specific practices I looked at. Their profiles are public, but calling out individual small-business dentists by name for fixable mistakes crosses into mean-spirited territory I don’t want to occupy. The patterns I describe are not unique to those practices anyway. They’re common across dental practices in every dense US urban market I’ve examined.
How I looked
What I did:
- Picked Midtown Atlanta, where ZIP codes 30308 and 30309 meet — a high-density, high-competition urban dental market with dozens of practices in walking distance.
- Identified the publicly visible dental practices ranking for “dentist Midtown Atlanta” and related queries.
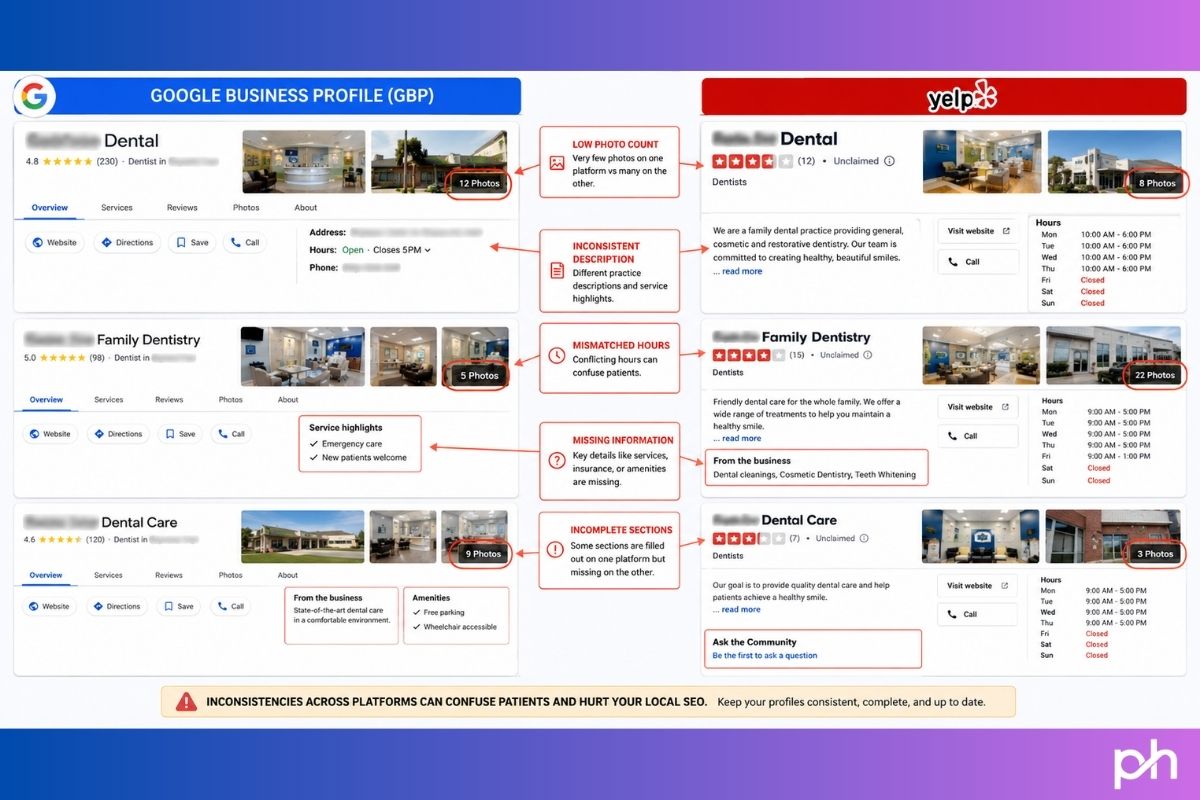
- For each practice, looked at what is observable from outside without claiming the listing: photo counts on Google Maps and Yelp, listed categories on both platforms, NAP (name, address, phone) consistency across the practice’s own website, Yelp, Google, and any third-party directories (WebMD, Healthgrades, Patient Connect 365, Demandforce) where they appear.
- Looked at the patterns rather than at any one profile in isolation.
Two limits to flag. First, some GBP signals (the live primary and secondary categories on the practice’s GBP itself, posts cadence, services list, Q&A activity inside Google) aren’t fully observable from the outside; I can only see what Google chooses to surface in search snippets. Where I couldn’t directly verify, I’ll note it. Second, my sample is one neighbourhood. The patterns I’m describing match what I see in other dense US markets, but they’re not a national audit.
What I found, in roughly the order I noticed it
1. Photo counts well below the benchmark
The current industry benchmark for a competitive GBP is at least 25 photos, with high-performing profiles in dense urban markets often carrying 50–100+. Birdeye’s 2026 State of Google Business Profile analysis pegs the engagement threshold at 15 photos and rising. WebFX’s 2026 GBP benchmarks report finds that profiles with photos earn 30–50% more views, with profiles carrying 10+ photos seeing roughly double the engagement of those with fewer.
In the practices I looked at, the visible photo counts on Yelp were: 6, 14, 20, 26, 37, 49, and 68. Only one practice in my sample crossed 50. Three were below 20. The picture on Google itself was somewhat better for the larger corporate-brand practices, but for the independent practices, the same gap appeared.
Why this matters in dollar terms: Google’s own widely-cited data shows that listings with photos receive about 42% more direction requests and 35% more website clicks compared to listings without. The lift compounds as photo libraries grow: BrightLocal-cited research finds that profiles with 100+ photos see substantially more phone calls and direction requests than the median listing.
For a dental practice, photos do double duty. They serve as the trust signal Google rewards, and they serve as the conversion signal for the patient. A dental practice is asking a stranger to put their hands inside the stranger’s mouth. A profile with six photos of a generic waiting room isn’t doing the job. A profile with forty photos showing the team, the operatory, the actual people the patient will meet, before-and-afters of real work — that is doing the job.
2. NAP inconsistency across platforms
This was the most actively damaging gap I saw. Specific patterns observed in the practices I examined:
- One practice listed two different phone numbers — both real, both 678 area code, but distinct — between its Yelp profile and the footer of its own website. To Google, this signals two possible business entities or an out-of-date listing somewhere.
- Another practice showed Monday–Thursday-only hours on Yelp and on its own website, but Monday–Friday hours on a third-party patient portal (Patient Connect 365). The third-party portal probably hadn’t been touched since setup; the discrepancy still exists in Google’s view of the entity.
- A third practice was listed at two different addresses across platforms — WebMD showed one street, the practice’s own current website showed another. Almost certainly a move that never got pushed out everywhere.
- Two practices in adjacent suites of the same office building have nearly identical names and overlap in services, increasing the chance Google conflates or misroutes one of them.
NAP consistency is the foundational signal Google uses to verify a business entity is real and active. Industry surveys (Yext, Whitespark) consistently put inconsistent NAP at the top of common local-SEO failure modes. Search Endurance’s 2026 GBP statistics summary notes that 7% of users abandon a search entirely when they encounter incorrect contact details. That’s not 7% of patients converting at a lower rate. That’s 7% gone, irrecoverable from that search.
3. Secondary categories left empty or generic
A GBP allows one primary category and up to nine secondary categories. The primary category drives the bulk of category-matched search visibility; the secondary categories let a practice surface for adjacent and long-tail queries (“pediatric dentist near me,” “cosmetic dentist Midtown,” “emergency dentist 30308”).
I can’t always see the live GBP secondary categories from outside, but the proxy — Yelp categories chosen by the same business owner — was telling. Most of the practices I looked at carried one or two basic Yelp categories: “General Dentistry,” “Dentists,” occasionally “Cosmetic Dentists.” A few used three or four. None of the independent practices I observed used the kind of full nine-slot category stack that would catch the breadth of intent the practice probably actually serves.
Industry-relevant secondary categories that almost no practice in my sample was using: Pediatric Dentist, Orthodontist, Endodontist, Dental Implants Periodontist, Emergency Dental Service, Sedation Dentist, Teeth Whitening Service, Dental Hygienist. Every one of these maps to its own search-volume pool. A practice that does general family dentistry plus implants plus emergency visits but lists only “Dentist” as its category is invisible for two of those three demand sources.
4. Q&A and engagement features ignored
I noticed, on multiple practices, that their Yelp Q&A sections carried the message “Yelp users haven’t asked any questions yet about [Practice].” I can’t see GBP Q&A directly from outside, but the parallel is strong: the platforms where engagement features can be filled by the business itself are consistently empty.
A dental practice has roughly the same five to ten patient questions asked repeatedly: Do you take my insurance? Do you offer payment plans? How long until I can get an appointment? Do you do sedation? Do you treat children? Do you handle emergencies? Every one of these can be answered preemptively in the practice’s own GBP Q&A. When the practice answers them, two things happen: the questions stop being asked over the phone (saving front-desk time) and the practice surfaces in answers when prospective patients search for those specific concerns.
Almost no practice I looked at had done this. The Q&A space is essentially abandoned.
5. Photo and post freshness, not just photo count
Photo count is the lagging indicator. The leading indicator is photo freshness. Google’s 2026 local algorithm weights real-world engagement signals more heavily than it did a year ago; one of those signals is whether the business is actively documenting itself (and being documented by customers) in something close to real time.
SOCi’s 2025 GBP data shows that businesses posting weekly see roughly 28% more website clicks and 42% more direction requests than businesses that post monthly. Searchlab’s 2026 summary cites 22% higher engagement for profiles updated with photos every 90 days versus stagnant listings. The practices I looked at varied here; some had recent photos but no posts, some had no recent activity at all. The pattern was the same as elsewhere: setup work was done once and then left.
What this is actually costing per practice, per year
Here is the part where I have to be careful. Cost math in local SEO is genuinely difficult because there are too many variables, and most “X new patients = $Y in lost revenue” figures floating around the industry are confidently wrong. I’m going to walk through a defensible illustrative case using cited inputs, and you can decide whether the assumptions fit your practice.
The inputs:
- Average monthly views for a dental GBP in a competitive urban market: industry estimates put a typical local-business GBP at roughly 1,000–1,500 monthly views (Searchlab 2026 summary cites an average of 1,260 views/month across categories).
- Photo gap impact: profiles with photos see roughly 42% more direction requests and 35% more website clicks than profiles without — Google’s own widely-cited stat. The lift is larger for profiles approaching 25+ and 100+ photo thresholds.
- Direction-request to booked-patient conversion: industry estimates vary widely; a conservative defensible assumption is 2–5% of direction requests becoming booked first visits.
- Dental patient lifetime value: a 2024 industry survey of about 13,000 practices, summarised by Delmain, puts average gross production per patient at roughly $4,200. General practices Delmain works with average $5,500–$7,500. Other industry sources commonly cite $10,000 as a general dentistry midpoint LTV.
- Dental patient acquisition cost: $200–$350 per new patient (Attainment Labs 2026 benchmarks); $150–$300 (Dataman Group); higher for specialty work.
Working it through for an illustrative practice:
Take a practice currently sitting at, say, 8 photos and inconsistent NAP across three platforms — a profile that is clearly underbuilt. The lift from getting the photo library to a properly maintained 25+ photo state and cleaning the NAP gaps would not bring the practice all of the 42% photo-impact lift in isolation (the lift is most pronounced versus zero-photo listings), but it would conservatively recover 15–25% of the direction-request and click engagement the listing currently misses.
On a 1,260-view-per-month baseline, that recovery is roughly 30–60 additional engagement actions per month. Run that through a 2% direction-request-to-patient conversion rate (conservative) and you’re at roughly 0.6 to 1.2 additional new patients per month, or 7 to 14 per year.
At $4,200 lifetime gross production per patient (the survey-of-13,000 figure from Delmain), seven additional patients per year is roughly $29,000 in unrealised lifetime production. Fourteen patients is about $59,000. At the $7,500 midpoint Delmain cites for general practices, the same math runs to $52,500–$105,000.
I want to be honest: these are ranges built on layered assumptions, not numbers I would put my name on for a specific practice without auditing it. The lift you actually recover depends on your starting baseline, your market, your conversion ops, and a dozen other variables. The headline I’d defend is narrower: the cost of leaving a dental GBP underbuilt in a competitive urban market is, conservatively, in the tens of thousands of dollars of unrealised lifetime production per year. Several practices I looked at in Midtown Atlanta are almost certainly running that cost right now and don’t know it.
Why this gap is so common (it’s not what you think)
The temptation is to assume small-practice owners haven’t heard about GBP optimisation. That’s not what I’m seeing. Most dental practice owners have heard the basics. The blocker isn’t awareness; it’s the absence of operational ownership.
A dental practice has three sources of GBP-relevant activity: the dentist (busy seeing patients), the office manager (busy running the practice), and the front desk (busy answering phones and scheduling). None of those roles is funded or trained to maintain GBP photo cadence, monitor Q&A weekly, audit NAP quarterly, and refresh secondary categories when service offerings expand. So nobody does it.
I noticed this even in the larger corporate-brand practices in my sample. One national-brand dental chain with a Midtown Atlanta location and tens of thousands of Google reviews across its network had only 14 photos on its visible Yelp profile and the kind of generic single-category setup I’d expect from a one-dentist suburban practice. The corporate marketing team is presumably focused on the centralised Google profile and the brand site. The platform-specific maintenance work for each individual location’s profiles is falling through.
This is what makes the gap durable. It’s not a strategy problem; it’s an ownership problem. And the practices that solve the ownership problem first — assign someone, train them, give them 60 minutes a week — pull away from the ones that don’t.
How to close the gap in roughly four hours of focused work
This is the operational checklist I’d give a practice in this situation. Not strategic, not clever; just tactical.
- Hour 1 — Photo upload sprint. Take or gather at least 25 photos covering five categories: exterior of the building, interior reception, operatory(ies), team headshots (with permission), and one to two before-and-after shots of real work (with patient consent). Upload to GBP. Then upload to Yelp. Then upload to Facebook. Skip stock photos entirely; they’re worse than fewer photos.
- Hour 2 — NAP audit and cleanup. Open your own website, your GBP, your Yelp, your Facebook, and any healthcare directories where you’re listed (Healthgrades, WebMD, Zocdoc, Patient Connect, Demandforce). Write the exact correct version of your practice name, address, suite number, and phone number on a sticky note. Then go through every listing and force every one to match exactly. If you find an old address from a previous location, fix it — do not leave the old listing hanging.
- Hour 3 — Categories and services. Open your GBP and add every relevant secondary category up to the 9 allowed: every practice-area term that fits (Cosmetic Dentist, Pediatric Dentist, Emergency Dental Service, Dental Implants Periodontist, Sedation Dentist, Teeth Whitening Service, Orthodontist if applicable, etc.). Then go to the Services section and list every individual service you offer with a one-sentence description each. This is the single highest-leverage hour in the four.
- Hour 4 — Q&A pre-population and posts setup. Write out the eight to ten most common patient questions you actually get on the phone. Post them in your GBP Q&A as questions, then answer them in the same session. Then set up a 90-minute monthly calendar event called “GBP refresh” assigned to whichever staff member is going to own this from here on out. The monthly job: 3 new photos, 1 GBP post, scan Q&A for new questions, respond to all new reviews.
Four hours up front. Roughly 90 minutes a month after that. That’s the entire intervention. The cost of doing it: one afternoon. The cost of not doing it: the math I walked through above.
The honest take
Dental SEO is sold as a complicated discipline, and at the margins it is. But the gap that costs most dental practices the most money isn’t a sophisticated SEO problem. It’s the failure to fully fill out a free tool every practice already has.
The practices in Midtown Atlanta that I looked at are competent, well-reviewed dental businesses. Their patients seem genuinely happy. Their websites are reasonable. But their Google Business Profiles — the asset that determines whether the next patient finds them at all — are leaving money on the table in ways that would take an afternoon to fix. That’s true across the dental practices I examine in every other dense US urban market too.
If you’re a dental practice owner reading this and you want to know whether your own GBP is in the shape I’ve described, I’m happy to run a free audit and tell you honestly. Get in touch via the contact page. If the answer is “you’re already doing this right,” I’ll tell you that too.